
Dear ,📚📝✨
This laboratory session is intended to intensify your understanding of non-linear models through the preparation of a comprehensive technical report on the Batch Gradient Descent method applied in the Logistic Regression model. The Jupyter Notebook file should provide a rigorous examination of these approaches, emphasizing their theoretical foundations, computational characteristics, and practical implications.
Introduction to the Palmer Penguins Dataset
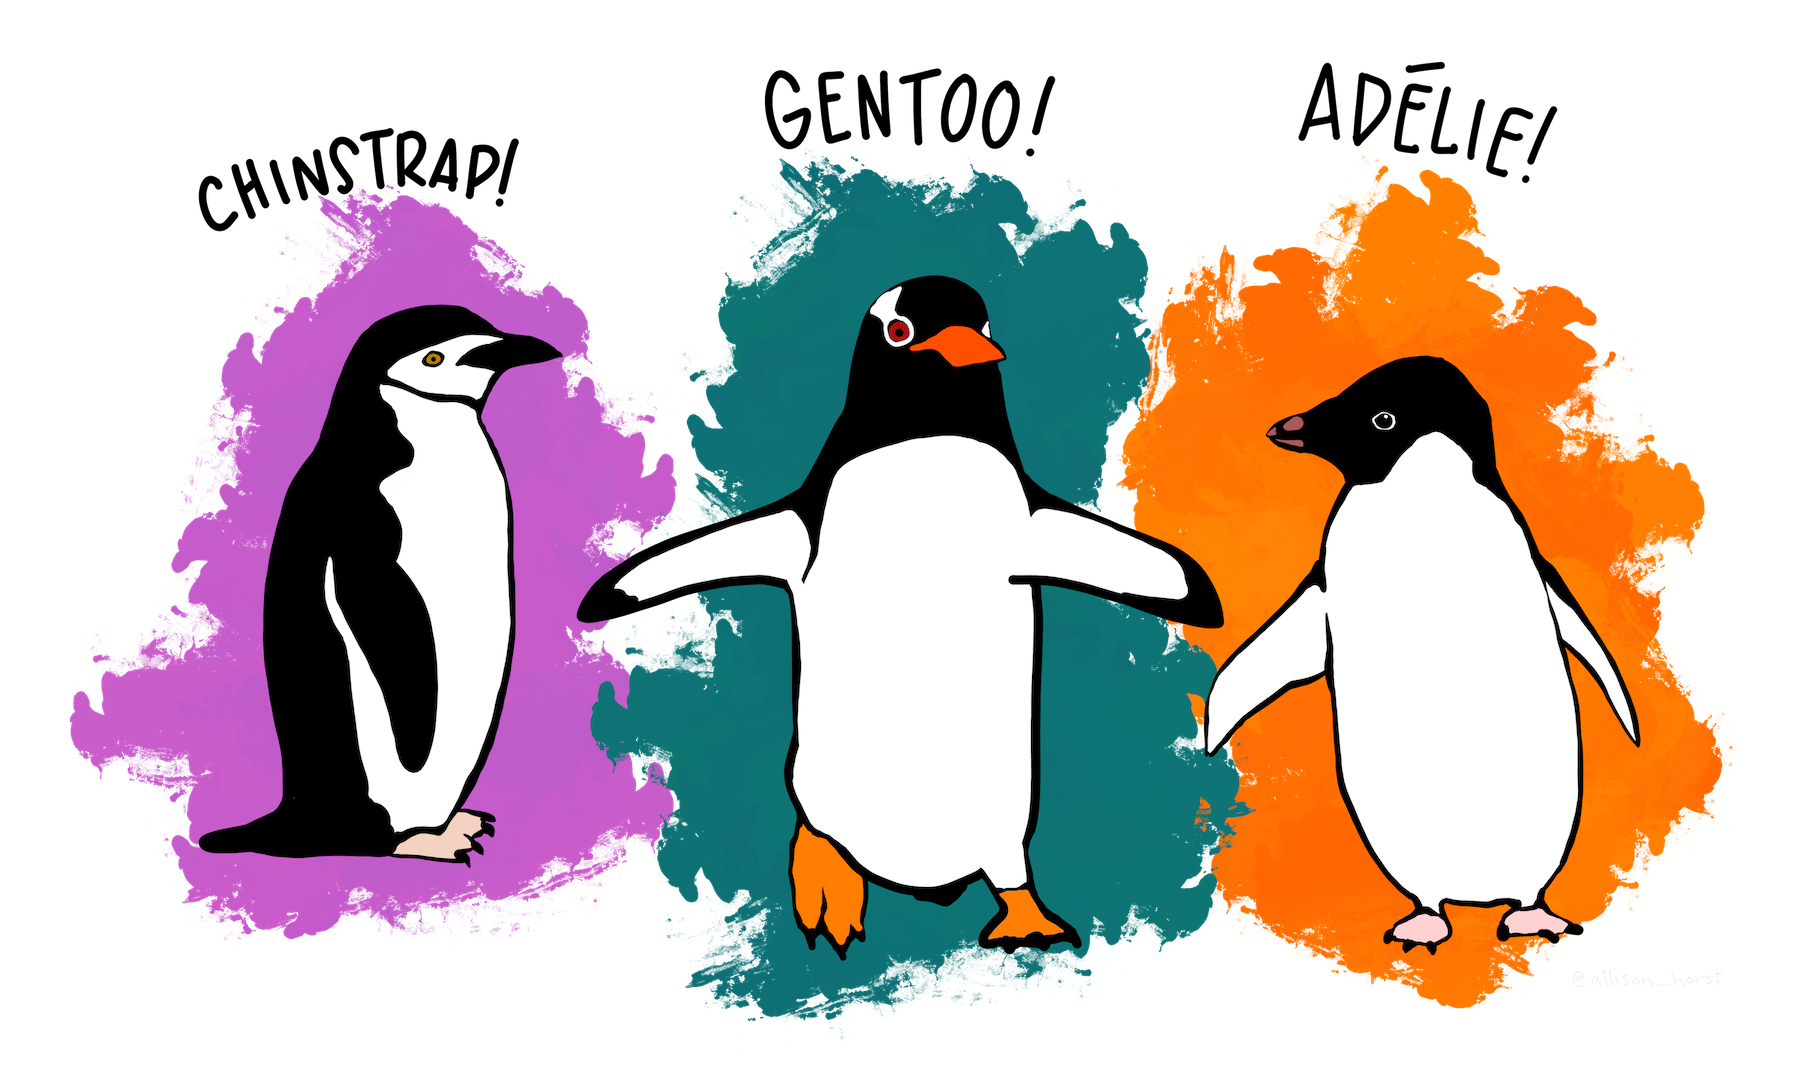
The Palmer Penguins dataset is a widely used dataset for classification and exploratory data analysis. It contains measurements of three penguin species collected from three islands in Antarctica. The dataset was originally published by Gorman KB, Williams TD, and Fraser WR (2014) to study penguin ecology.
Dataset Features
The dataset consists of 344 observations and includes the following attributes:
• Species: The target variable (Adelie, Chinstrap, or Gentoo).
• Island: The island where the penguin was observed (Biscoe, Dream, Torgersen).
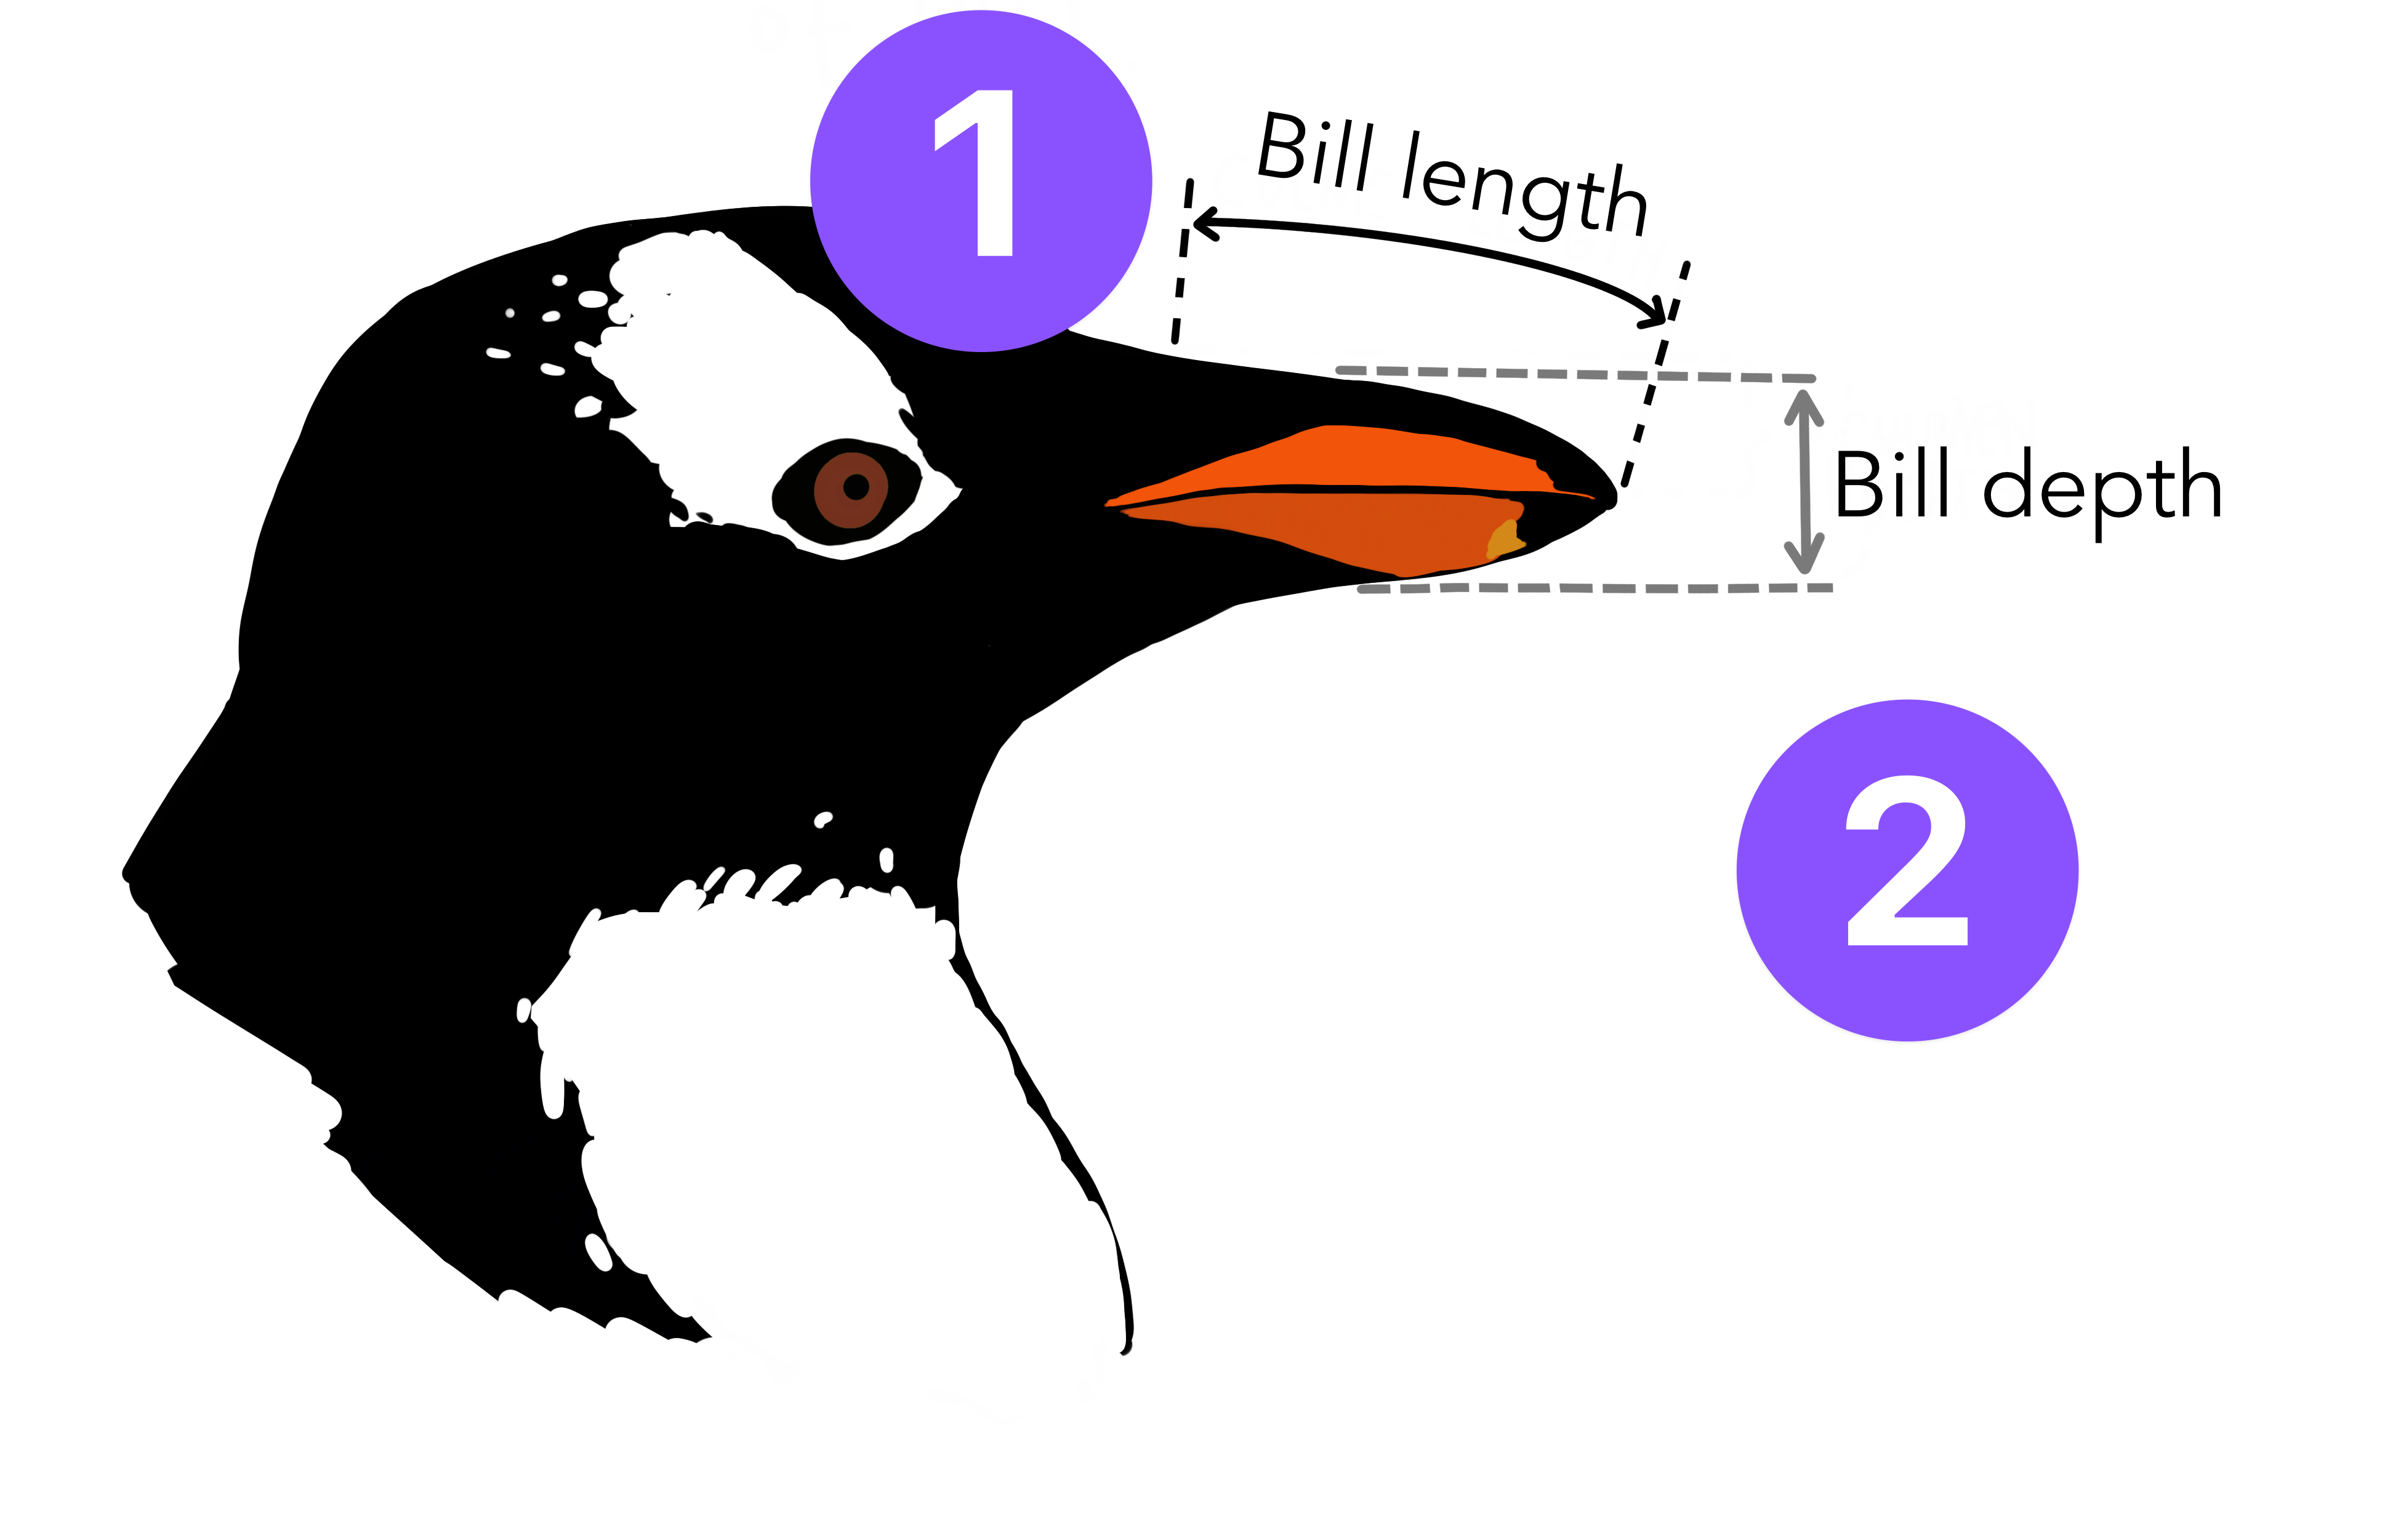
• Bill Length (mm): Length of the penguin’s bill.
• Bill Depth (mm): Depth (thickness) of the bill.
• Flipper Length (mm): Length of the penguin’s flippers.
• Body Mass (g): The weight of the penguin.
• Sex: The sex of the penguin (male/female).
Note: In the provided dataset, bill length and depth are renamed as variables bill_length_mm and bill_depth_mm to be more intuitive.
Your task is to analyze the dataset and train a logistic regression model to classify the species based on available features.
Objectives and Required Tasks
Students are expected to conduct independent research, implement the discussed methods, and present a structured Jupyter notebook file detailing their findings and results. Thus, the report development must consider the following points (points marked ☑️ are students' tasks) :
1. Theoretical Background
-
☑️ Provide a detailed theoretical discussion on the Logistic Regressors for classification.
-
Use LaTeX to formally present the mathematical background for:
-
☑️ The deterministic method of the Log-Loss function and its Batch-Gradient Descent implementation.
-
2. Dataset Utilization 💾
3. Analysis and visualization
-
☑️ Plot the different features and define the best for the classification task.
- Considering the best parameters:
-
☑️ Use pair plots to visualize relationships between numerical variables.
-
☑️ Use scatter plots to see how features differ across species.
-
4. Feature selection and preprocessing
-
☑️ Encode categorical variables in numbers (island, sex, and species).
5. Train and Evaluate a Logistic Regression Model
- ☑️ Train a Binary Logistic Classifier Model for species.
- ☑️ Tune hyperparameters to obatian the best results.
- ☑️ Try different feature combinations(x) and compare model performance using J(MSE).
- ☑️ If it is possible, plot the model classification performance against the dataset.
- ☑️ Present the best model to classify penguin species.
6. Conclusions ☑️
-
☑️ Discuss the impact of dataset parameters, hyperparameters, and preprocessing on model's performance.
Presentation Deadlines 📅
-
Monday Session: October 30th (AE2 Room 12pm-14pm)
-
Wednesday Session: November 6th (AE2 Room 12pm-14pm)
Recommendations for Effective Completion
-
Organized Workflow 📂: Maintain a structured repository for assignments and create backups.
-
Clarification Requests: Address any uncertainties with the instructor well before the deadline.
-
Early Preparation ⏰: Commence work promptly to allow sufficient time for research and troubleshooting.
-
Regular Updates 📩: Monitor email correspondence for potential modifications to the requirements.
Happy coding!
Gerardo Marx,
Lecturer of the Artificial Intelligence and Automation Course,
gerardo.cc@morelia.tecnm.mx